Introduction to Hypothesis Testing
After exploring methods to estimate population parameters, attention now shifts to the second core activity in inferential statistics: hypothesis testing. This process is essential for making informed decisions based on sample data. Hypothesis testing provides a structured framework to assess claims or assumptions about a population, helping to determine whether observed outcomes are likely the result of random chance or statistically significant patterns.
In this section, the primary focus will be on introducing the essential components and terminology that form the foundation of hypothesis testing. In the next section, these ideas will be applied by analyzing specific scenarios and carrying out complete hypothesis tests. However, to motivate the discussion, we will start with a quick example to help show what we want to accomplish.
Example : Gender Choice Drug
Consider a gender choice drug that claims to increase the chance of having a girl. Conduct an informal analysis of the following two scenarios:
- 53 girls out of 100 births
- 95 girls out of 100 births
Determine whether these results support the claim that the drug increases the likelihood of having a girl.
Solution
Let’s informally make a decision about the two scenarios:
- We normally expect around 50 girls in 100 births. The result of 53 girls is close to 50, so we should not conclude that the Gender Choice product is effective at increasing the chance of having a baby girl. Why? The result of 53 girls could easily occur by chance, so we would say that there isn’t sufficient evidence to conclude that the Gender Choice drug is effective, despite the fact that the proportion of girls in this experiment is slightly larger than the 50% we normally expect.
- If we had 95 girls in 100 births, that would be extremely unlikely to occur by chance. Why? Because we normally expect around 50 girls in 100 births. We could explain the occurrence of 95 girls in one of two ways: (1) Either an extremely rare event has occurred by chance, or (2) this situation is good evidence in support of the Gender Choice drug being effective. So we would reject our original assumption that “the drug has no effect.”
Components of Hypothesis Testing
Before performing a full hypothesis test, it is important to understand the key components involved. This section introduces the foundational elements of hypothesis testing.
Definition: Hypothesis
A hypothesis is a claim or statement about a property of a population parameter.
Definition: Hypothesis Test
A hypothesis test (or test of significance) is a formal procedure for testing a claim about the property of a population parameter.
Example : Claims and Symbols
Below are two example claims with their symbolic representations:
- Claim: "The mean body temperature of humans is less than \( 98.6^\circ F \)"
- Symbolic form: \(\mu < 98.6\)
- Claim: "The proportion of children preferring the Helper toy is greater than 50%"
- Symbolic form: \(p > 0.50\)
Definition: Null Hypothesis
The null hypothesis (\( H_0 \)) is a statement that the value of a population parameter is equal to some claimed value.
Definition: Alternative Hypothesis
The alternative hypothesis (\( H_a \)) is the statement that the parameter has a value that differs from the null hypothesis. The alternative hypothesis always includes one of the following symbols: \( <,>, \neq \).
Before diving into hypothesis testing, it may be helpful to review common mathematical symbols, as recognizing these relationships is essential for correctly setting up null and alternative hypotheses.
This table shows original mathematical comparison symbols and their logical opposites.
| Original Symbol | \( < \) | \( > \) | \( \leq \) | \( \geq \) | \( = \) | \( \neq \) |
|---|---|---|---|---|---|---|
| Opposite Symbol | \( \geq \) | \( \leq \) | \( > \) | \( < \) | \( \neq \) | \( = \) |
Steps for Identifying \( H_0 \) and \( H_a \)
-
Identify the original claim and express it in symbolic form.
So say that the original problem says "Use the experimental data test the claim that more than 50% choose the helper toy". We could write this claim into symbols and get:
Original Claim: \(p > 0.50\)
-
Write the opposite claim in symbolic form.
Using our scenario above, we could write the opposite claim with the following symbols:
Opposite Claim: \(p \leq 0.50\)
-
Determine which claim represents the null hypothesis (\( H_0 \)) and which represents the alternative hypothesis (\( H_a \)).
-
The claim with the equality will always be your \(H_0\) and it is written with just an equal sign.
In our example, the opposite claim will be our null hypothesis (\( H_0 \)). We will write this in the following way:
\( H_0 \): \(p = 0.50\)
-
The claim that contains \(<,>,\) or \(\neq\) will be the alternative hypothesis \(H_a\).
In our example, the original claim will be our alternative hypothesis (\( H_a \)) since it contained the \(>\) symbol. We will write this in the following way:
\( H_a \): \(p > 0.50\)
-
Example : Identifying \(H_0\) and \( H_a \)
For each claim below, identify the null and alternative hypotheses:
- "The proportion of drivers admitting to running red lights is greater than 0.7."
- "The average height of professional basketball players is at most 7 feet."
- "The standard deviation of IQ scores of actors is equal to 15."
Solution
- Original Claim: \( p > 0.7 \)
Opposite Claim: \( p \leq 0.7 \)
\( H_0: p = 0.7 \), \( H_a: p > 0.7 \) - Original Claim: \( \mu \leq 7 \)
Opposite Claim: \( \mu > 7 \)
\( H_0: \mu = 7 \), \( H_a: \mu > 7 \) - Original Claim: \( \sigma = 15 \)
Opposite Claim: \( \sigma \neq 15 \)
\( H_0: \sigma = 15 \), \( H_a: \sigma \neq 15 \)
Conducting Hypothesis Tests with GeoGebra
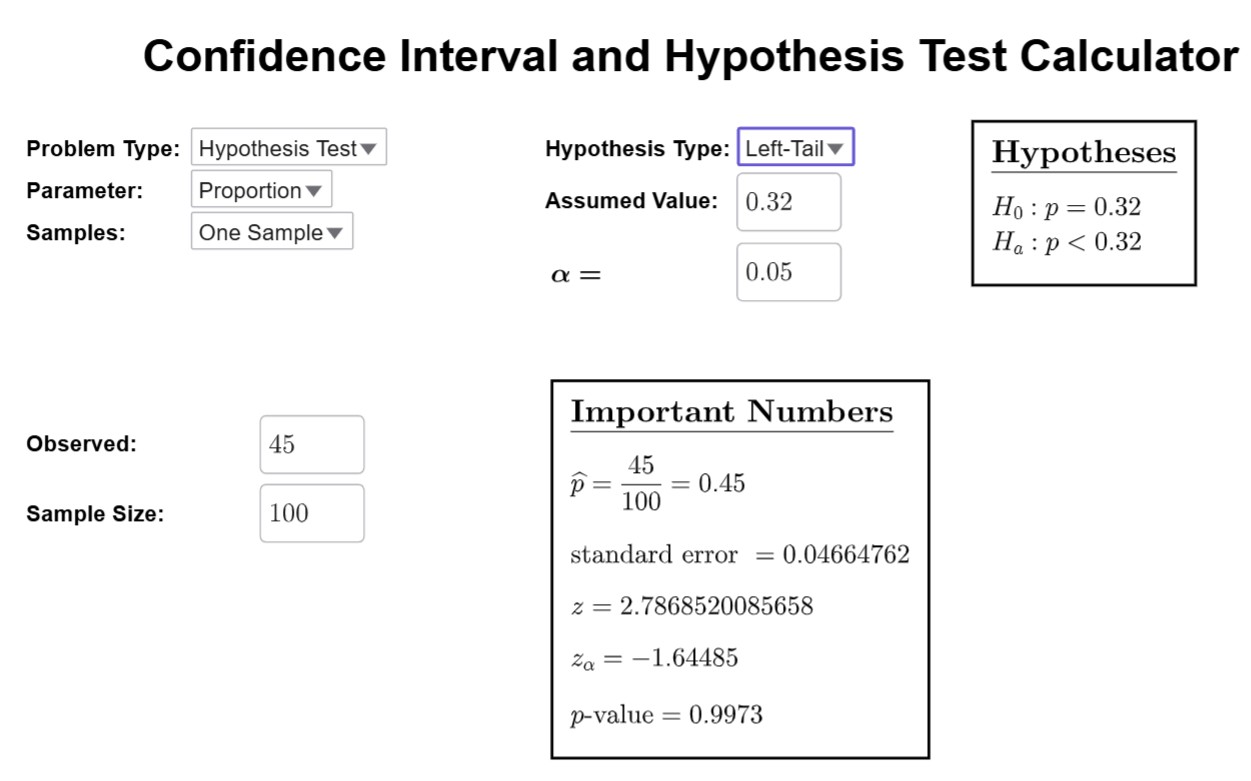
Once we have set up our null \(H_0\) and alternative hypothesis \(H_a\), we can now go to technology. We will use GeoGebra to perform the calculations related to hypothesis testing. Input the null and alternative hypotheses and the relevant sample data into the applet.
Interactive calculator for confidence intervals and hypothesis testing.
Opens the calculator in a new tab.
When using GeoGebra the following options will be selected:
- Problem Type: Choose "hypothesis test"
- Parameter: choose "proportion" or "mean" based on what is being testing
- Samples: Choose "one sample"
- Hypothesis Type: this is all based on what symbol your \(H_a\) contains
- Choose "Left-Tail" if \(H_a\) has a "\(<\)" symbol
- Choose "Right-Tail" if \(H_a\) has a "\(>\)" symbol
- Choose "Two-Tail" if \(H_a\) has a "\(\neq\)" symbol
- Assumed Value: this is the value in your \(H_0\).
- \(\alpha\): this is your significance level in the problem
P-Value Method for Hypothesis Testing
The p-value method is commonly used to make initial conclusions about a hypothesis test. After obtaining the p-value from technology (calculators, Excel, GeoGebra, etc.) the decision-making process is as follows:
- Reject \( H_0 \): If the p-value \( \leq \alpha \) (where \( \alpha \) is the significance level, such as 0.05, 0.01, or 0.1). An easy mnemonic device to help you remember this: "If the p is low, the null must go."
- Fail to Reject \( H_0 \): If the p-value \( > \alpha \). You can use this phrase to help you remember this: "If the p is high, the null will fly!"
Example : Small P-Value
A hypothesis test yields a p-value of \( 2.4 \times 10^{-4} \). If \( \alpha = 0.01 \), determine the initial conclusion.
Example : Larger P-Value
A hypothesis test yields a p-value of \( 0.086 \). If \( \alpha = 0.05 \), determine the initial conclusion.
Wording the Final Conclusion
The final conclusion of a hypothesis test must be clearly stated, addressing the original claim in non-technical language. Avoid stating "reject the null hypothesis" or "fail to reject the null hypothesis." Instead, frame the conclusion based on the context of the problem and evidence provided by the test.
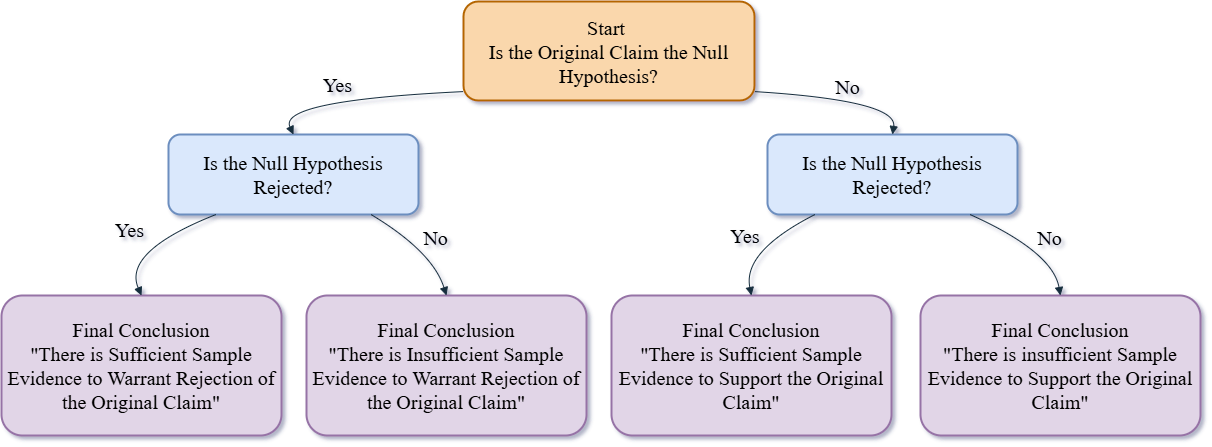
Flowchart for Final Conclusions
The flowchart below outlines the decision-making process for formulating the final conclusion in a hypothesis test:
Example : Proportion of Blue M&Ms
Given the following information, determine the final conclusion of the hypothesis test:
- Original Claim: The proportion of blue M&Ms is greater than 5%.
- Initial Conclusion: Fail to reject the null hypothesis.
Example : Mean Volume of Soda Cans
Given the following information, determine the final conclusion of the hypothesis test:
- Original Claim: The mean volume of soda cans is 12 oz.
- Initial Conclusion: Reject the null hypothesis.